new
improved
Revlitix Product Release May 2025
Revlitix Product Release May 2025: Report to Slides, Planner Upgrades, Funnel Improvements & More
May is here, and so are new capabilities inside Revlitix that make reporting, forecasting, and data storytelling even more seamless. From turning your charts into decks to simplifying goal uploads and funnel breakdowns, here’s everything you need to know.

What’s New
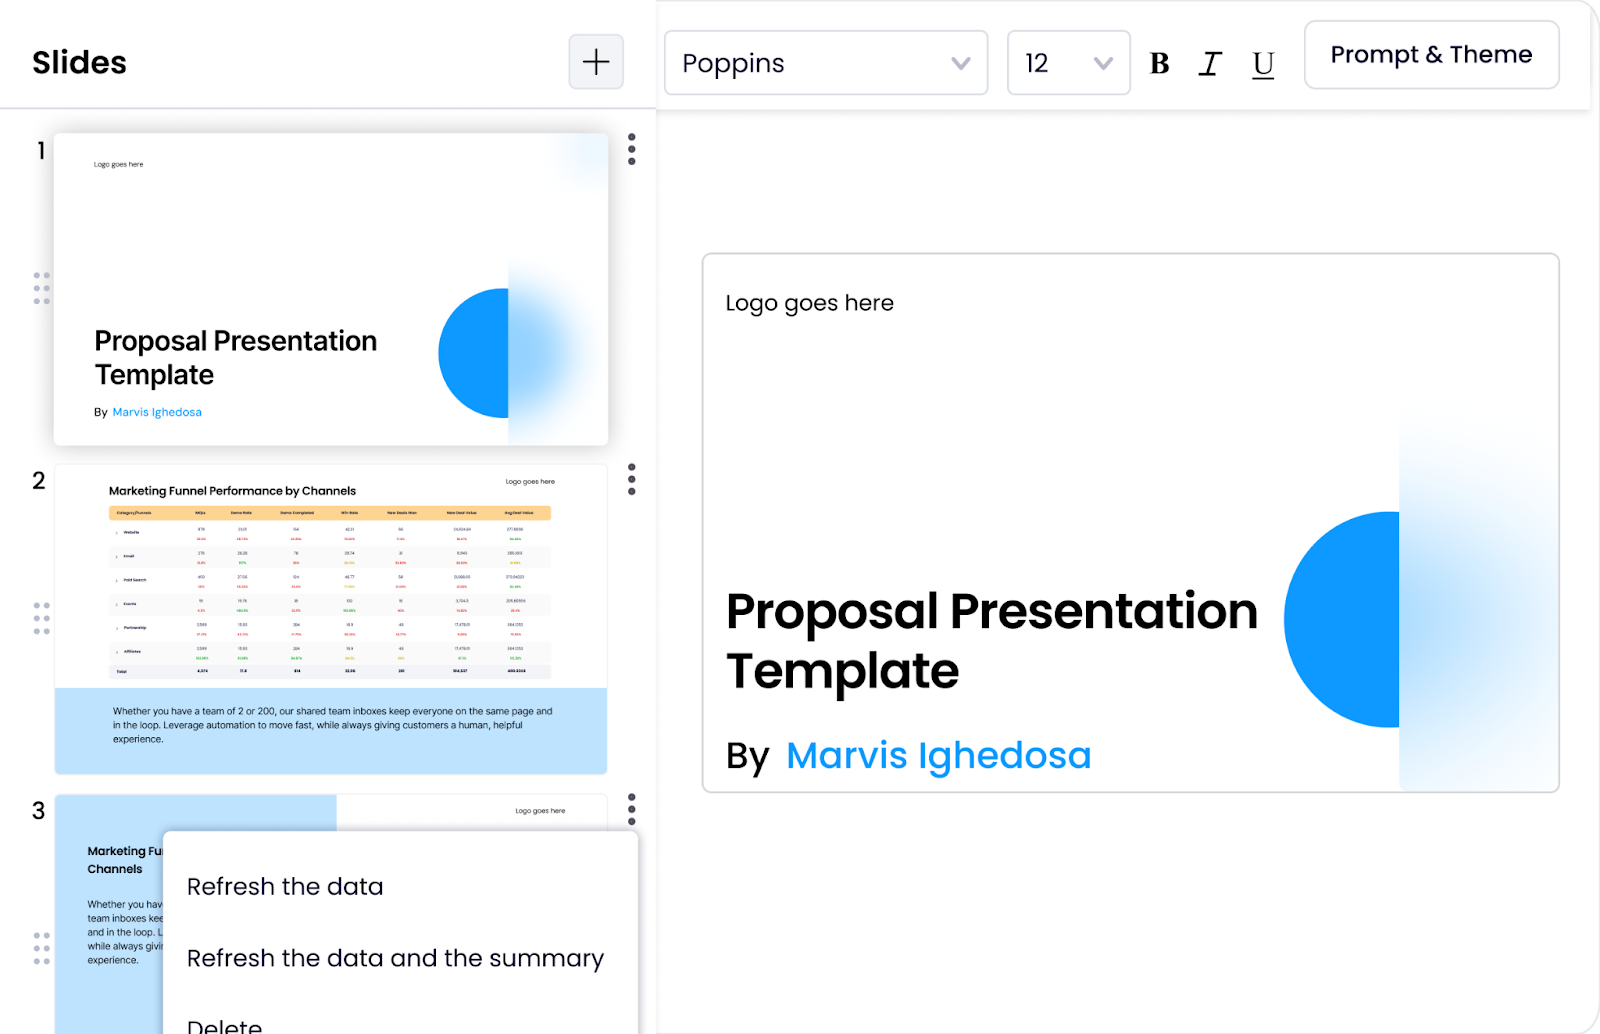
Report to Slides: Create Decks Directly from Your Dashboards
No more manual copy-pasting screenshots into PowerPoint. With Report to Slides, you can now convert any Revlitix report into presentation-ready slides.
Use Case:
Your leadership review is in 10 minutes and you need a deck with updated KPIs, charts, and summaries. Just click "Export to Slides" and get an editable, branded presentation in seconds.
Improvements
Planner: Duplicate and Save Forecast Values
You can now duplicate existing Planners and save your forecasted values directly within them. This makes scenario planning faster and reduces repeated work.


Use Case:
Need to run multiple versions of a pipeline forecast based on different assumptions (e.g. best case, base case, worst case)? Simply duplicate your planner and tweak the values—no need to build it again.
CSV Upload for Goal Tracking
Upload your goal data using CSV files in:
- Report-level Goal Tracking Charts
- The Sales Goal Tracker

Use Case:
If you maintain sales targets or marketing goals in Excel or Google Sheets, now you can upload them directly into Revlitix instead of manually inputting each value.
Summation in Comparison Charts
You can now view the total, average, minimum, and maximum values directly in Comparison Charts.

Use Case:
Let’s say you’re comparing the number of leads from five channels. Instead of manually calculating totals, Revlitix now displays aggregate stats directly in the chart.
Funnel Metrics as KPIs in Donut Charts
Funnel metrics (for single-object funnels) can now be used as KPIs in Donut Charts.

Use Case:
Want to show what % of your SQLs turned into opportunities in a quick visual format? Add your funnel metric to a Donut Chart and use it in dashboards or slide exports for quick stakeholder consumption.
Raw Data Expansion in Funnel Charts
Both standard and custom metrics now support raw data expansion in Funnel Charts—offering full visibility into what’s behind each funnel stage.\

Use Case:
You’re reviewing a conversion drop-off between MQL to SQL. With raw data expansion, you can now directly examine the records contributing to that stage’s value for faster analysis.
Have questions or need help with setup? Just reply or reach out to your Revlitix CSM.